Heroin
Heroin addiction is a disease of chronic relapse that harms the individual through devaluation of personal responsibilities in favor of finding and using drugs. Only some recreational heroin users devolve into addiction but the basis of these individual differences is not known. We use animal models to examine the behavioral and molecular neurobiological mechanisms of heroin addiction.

Identification of Differential Gene Expression by RNA-Seq. (A) Hierarchical clustering of genes and samples for the 685 differentially expressed transcripts (ANOVA,SNK pairwise posthoc, fold change >|1.25|. (B) Relationship between samples through principal component analysis based on the differentially expressed genes. Samples segregated along the first component by group. (C) Venn diagram representation of the differentially expressed transcripts. A number of common changes were observed between heroin groups and Saline and in the comparisons between Large Supressors and Saline and Small Suppressors. n = 4–5/group.
From: Assessment of individual differences in the rat nucleus accumbens transcriptome following taste-heroin extended access. Imperio CG, McFalls AJ, Colechio EM, Masser DR, Vrana KE, Grigson PS, Freeman WM. Brain Res Bull. 2016 May;123:71-80. doi: 10.1016/j.brainresbull.2015.12.005.
Alcohol
The biomarker panel reflects changes in multiple organ systems and suggests robust changes in the plasma proteome with drinking that might serve as a sensitive and specific diagnostic test. The specific plasma proteins altered with alcohol self-administration might represent indicators of alcohol-induced stress on a variety of organ systems. We have developed a set of proteins that can be used to accurately differentiate nonhuman primates into nondrinking, nonabusive drinking, and abusive drinking categories. This biomarker panel is undergoing testing in human subjects to establish its clinical utility.
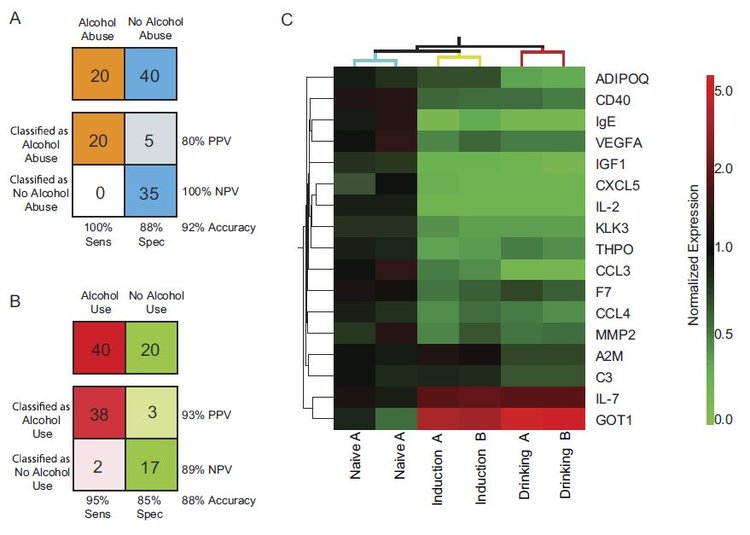
(A) With a three-protein panel and support vector C machine classification algorithm, alcohol abuse samples (Drinking) were correctly classified from nonalcohol-abusing samples (Naive and Induction) with 92% accuracy and 100% sensitivity. (B) With a 14-protein panel and support vector machine classification algorithm, alcohol-using samples (Induction and Drinking) were correctly classified from nonalcohol-using samples (Naive) with 88% accuracy and 95% sensitivity. (C) Heat map representation of the 17-protein biomarker panel and clustering of the sample groups. Mean expression levels normalized to a mean naive level of one for each drinking state and time point were clustered by condition. Increased abundance, compared with mean Naive, is presented in red, and reduced abundance is presented in green. Independent samples from each drinking state clustered together. PPV, positive predictive value; NPV, negative predictive value; ADIPOQ, adiponectin; IgE, immunoglobulin E; VEGFA, vascular endothelial growth factor A; IGF1, insulin-like growth factor-1; CXCL5, chemokine ligand 5; IL2, interleukin 2; KLK3, kallikrein-related peptidase 3; THPO, thrombopoietin; CCL3, chemokine (C-C motif) ligand 3; F7, Factor VII; CCL4, chemokine (C-C motif) ligand 4; MMP2, matrix metallopeptidase 2; A2M, alpha-2-macroglobulin; C3, complement component 3; IL7, interleukin 7; GOT1, glutamic-oxaloacetic transaminase 1.
From: Classification of alcohol abuse by plasma protein biomarkers. Freeman WM, Salzberg AC, Gonzales SW, Grant KA, Vrana KE. Biol Psychiatry. 2010 Aug 1;68(3):219-22. doi: 10.1016/j.biopsych.2010.01.028.